
Platform Pricing Comes At A Cost
Pricing power dynamics: why Apple can charge 30%, Airbnb only 15%?

Platforms and Marketplaces1 are one of the defining business models of the internet. Amazon matches sellers with buyers, Uber connects drivers and riders, Airbnb brings together hosts and guests, and the list goes on. Their strength lies in network effects - more users attract more suppliers, and more suppliers attract ever more users. But network effects alone do not guarantee success. Pricing is just as critical. Venture Capitalist Bill Gurley argued in his article on marketplace dynamics that the take rate (also known as rake, revenue share, commission, or transaction fees) a platform takes shapes who joins, who stays, and whether the business succeeds.
Building on that, I classify platforms and marketplaces by their business model into four kinds. Their pricing power, i.e. what they can charge and what they must give up, depends on where they land in this classification2.
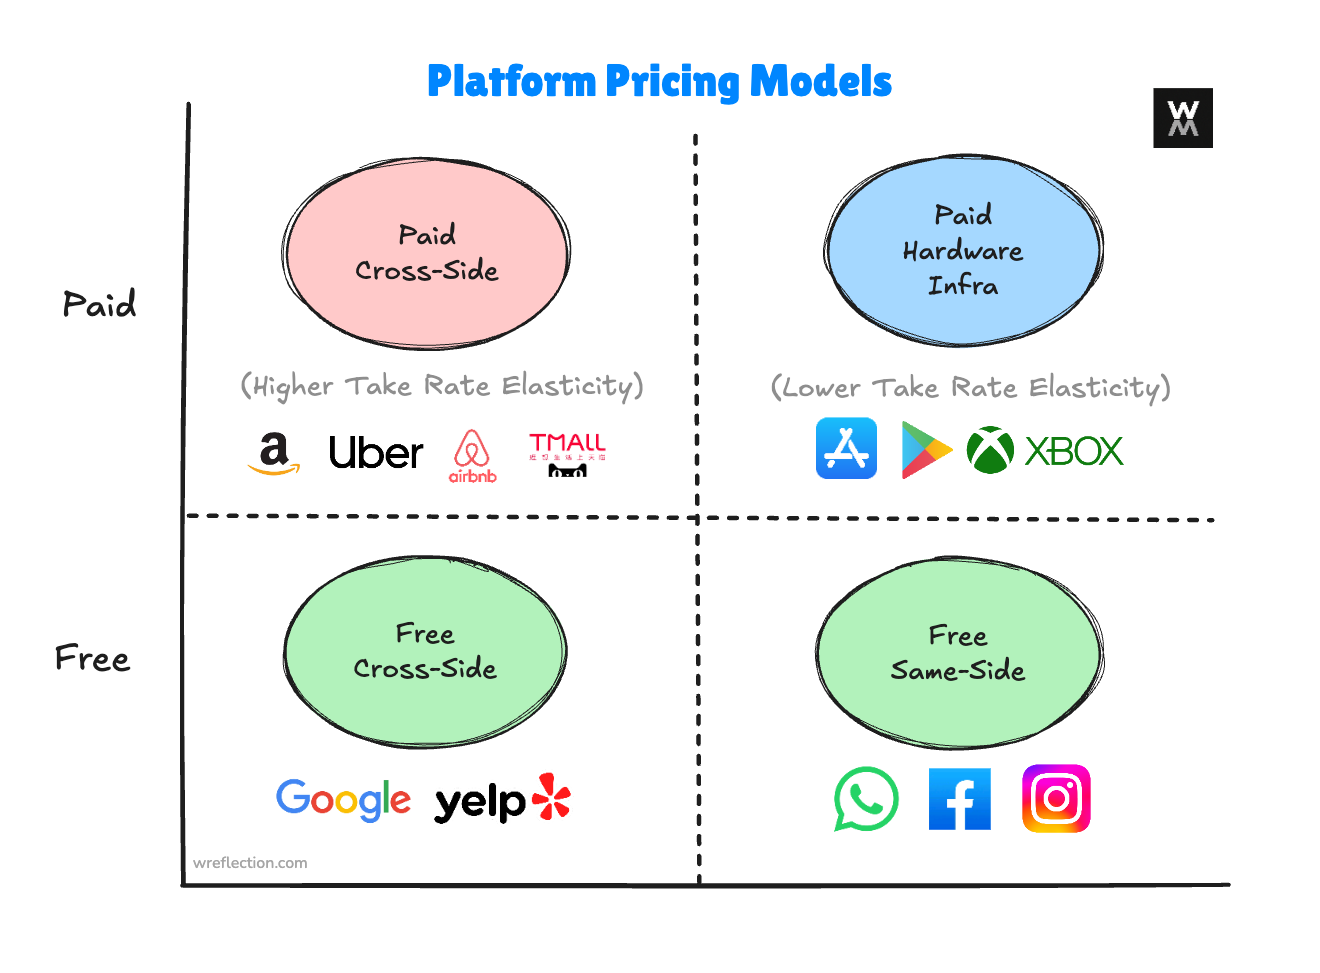
Paid Cross-side Platforms – These platforms create value primarily by enabling direct exchanges between its consumers and producers, and benefit from cross-side network effects, i.e. the volume and nature of merchants attracts users, and more users attract more merchants. Interaction is cross-directional, from sellers to customers and customers to sellers. Customers do not typically interact with other customers (and merchants do not necessarily interact with other merchants). Examples are Airbnb, eBay, Amazon Marketplace, Alibaba’s Tmall, Uber, Lyft etc. I call them paid platforms because they charge merchants a take rate when they sell to customers. Paid platforms are typically take rate-elastic (I define “Take Rate Elasticity” as the sensitivity of seller participation to changes in a platform’s take rate, with pass-through to end prices; see footnote3). If fees rise too high, sellers will look for cheaper alternatives. With no hardware or infrastructure lock-in, competitors can lure sellers away by offering lower fees. Managed platforms, however, can sustain higher take rates if customers or merchants see value in the oversight and service they provide.
Infra/Hardware Cross-side Platforms – Cross-side platforms or marketplaces built on top of an infrastructure or hardware layer are unique because these platforms do not typically attract users by the volume and nature of the merchants on their platforms; rather the hardware attracts users, and the users then attract merchants. In some cases, unique infrastructure (warehouses, delivery mechanisms, curated storefronts) pulls in merchants on its own. In either case, because demand is captive to a locked-in installed base and/or the platform offers infrastructure that sellers can’t get elsewhere, these platforms are more take rate-inelastic, and can charge higher take rates without losing their best suppliers. Examples include Apple Appstore, Xbox Gamestore, Google Playstore. Theoretically, even a physical marketplace in a unique location that allows merchants to sell their wares, and charges them on a revenue share model falls in this category. Fulfillment by Amazon fits here too. Its vast warehouses and logistics network are costly to copy, giving Amazon structural bargaining power to set storage/fulfillment fees.
Free Cross-side Platforms – These platforms charge neither consumers nor producers at the point of exchange. Exchanges between their consumers and producers are almost always free. Instead, the platforms monetize attention; more users bring more engagement, which advertisers then pay to access. They benefit from cross-side network effects. Google and Yelp are examples of this kind of platform. Pricing power comes from audience quality, auction dynamics, and measurable return on investment (ROI). Platforms with affluent, high-intent users sell higher-value attention, and if ads convert and targeting is superior, bids rise.
Same-side Platforms – These platforms create value by enabling direct exchange among its users, and are monetized either by charging the users directly (rare), or by charging advertisers to sell services to users (most often). Messaging apps, social networks, and communities are examples, and these platforms benefit from same-side effects (more users -> more users) and once there is a valuable installed base, one-way cross-side effects (more users -> more advertisers). But note that more advertisers do not directly mean more customers. In fact, more ads -> (arguably) poorer customer experience -> fewer customers. WhatsApp, Facebook, Instagram, WeChat, Snapchat are examples.
Some companies sit across multiple models or blend different characteristics but products typically pertain to one model. For example, Google Search is a Free Cross-side Platform for search, but Gmail is a Same-side Platform. YouTube is a Paid Cross-side Platform despite being free to users, as it takes a portion of advertising revenue before paying creators.
Platform Type Determines Take Rate Elasticity
Based on the above classification and given a platform business model, how much take rate can the marketplace bear? The most important factor is the actual margin of each supplier on the platform. If suppliers themselves only have 20% margin, they cannot bear 20% in platform fees. But beyond that, the platform’s structural position determines what it can extract without losing suppliers.
Paid Cross-side Platforms are more take rate-elastic because a competing platform with lower take rate can first attract sellers on fees, and then eventually win customers as sellers pass the savings on as lower prices. That’s why I think Airbnb must keep its take rate around 15%. Because attempting to increase it would invite competitors to undercut on fees, attract its hosts, and ultimately capture its customers with lower prices. Infra/Hardware Platforms get away with higher take rate because of their hardware differentiation. That’s why Apple’s Appstore can get away (and they have for 15+ years) with charging developers a high take rate (the famous 30% Apple Tax) because even if a competing platform like Android offered a lower take rate (say 5%), users are unlikely to switch as long as Apple’s hardware remains attractive. Here’s a thought exercise - if Apple increased its take rate to 50%, would the quality and quantity of apps materially suffer? Would customers switch platforms to Android? In my view, change is more likely to come from regulators or technological shifts (e.g. AI devices) than from competitors or customers.
In Free Platforms and Same-side Platforms, prices charged to advertisers don’t (directly) affect the prices on customers, so theoretically new platforms cannot undercut the price (charged to advertisers) of the dominant platform and capture more users. The way to capture marketshare is to offer differentiated service (Facebook vs. Myspace, TikTok vs. Facebook).
From a cost point of view, there are three costs at play in a platform business. Fixed operating costs that do not vary with each unit of output (i.e. expenses that are largely constant over a range and only step changes as the platform grows such as office rent, most employee salaries), variable costs that vary with each unit of output (i.e. costs that vary with the number of sellers and customers serviced such as payment processing)4, and an upfront capital expense incurred in developing the platform (primarily in physical assets and hardware costs)5.
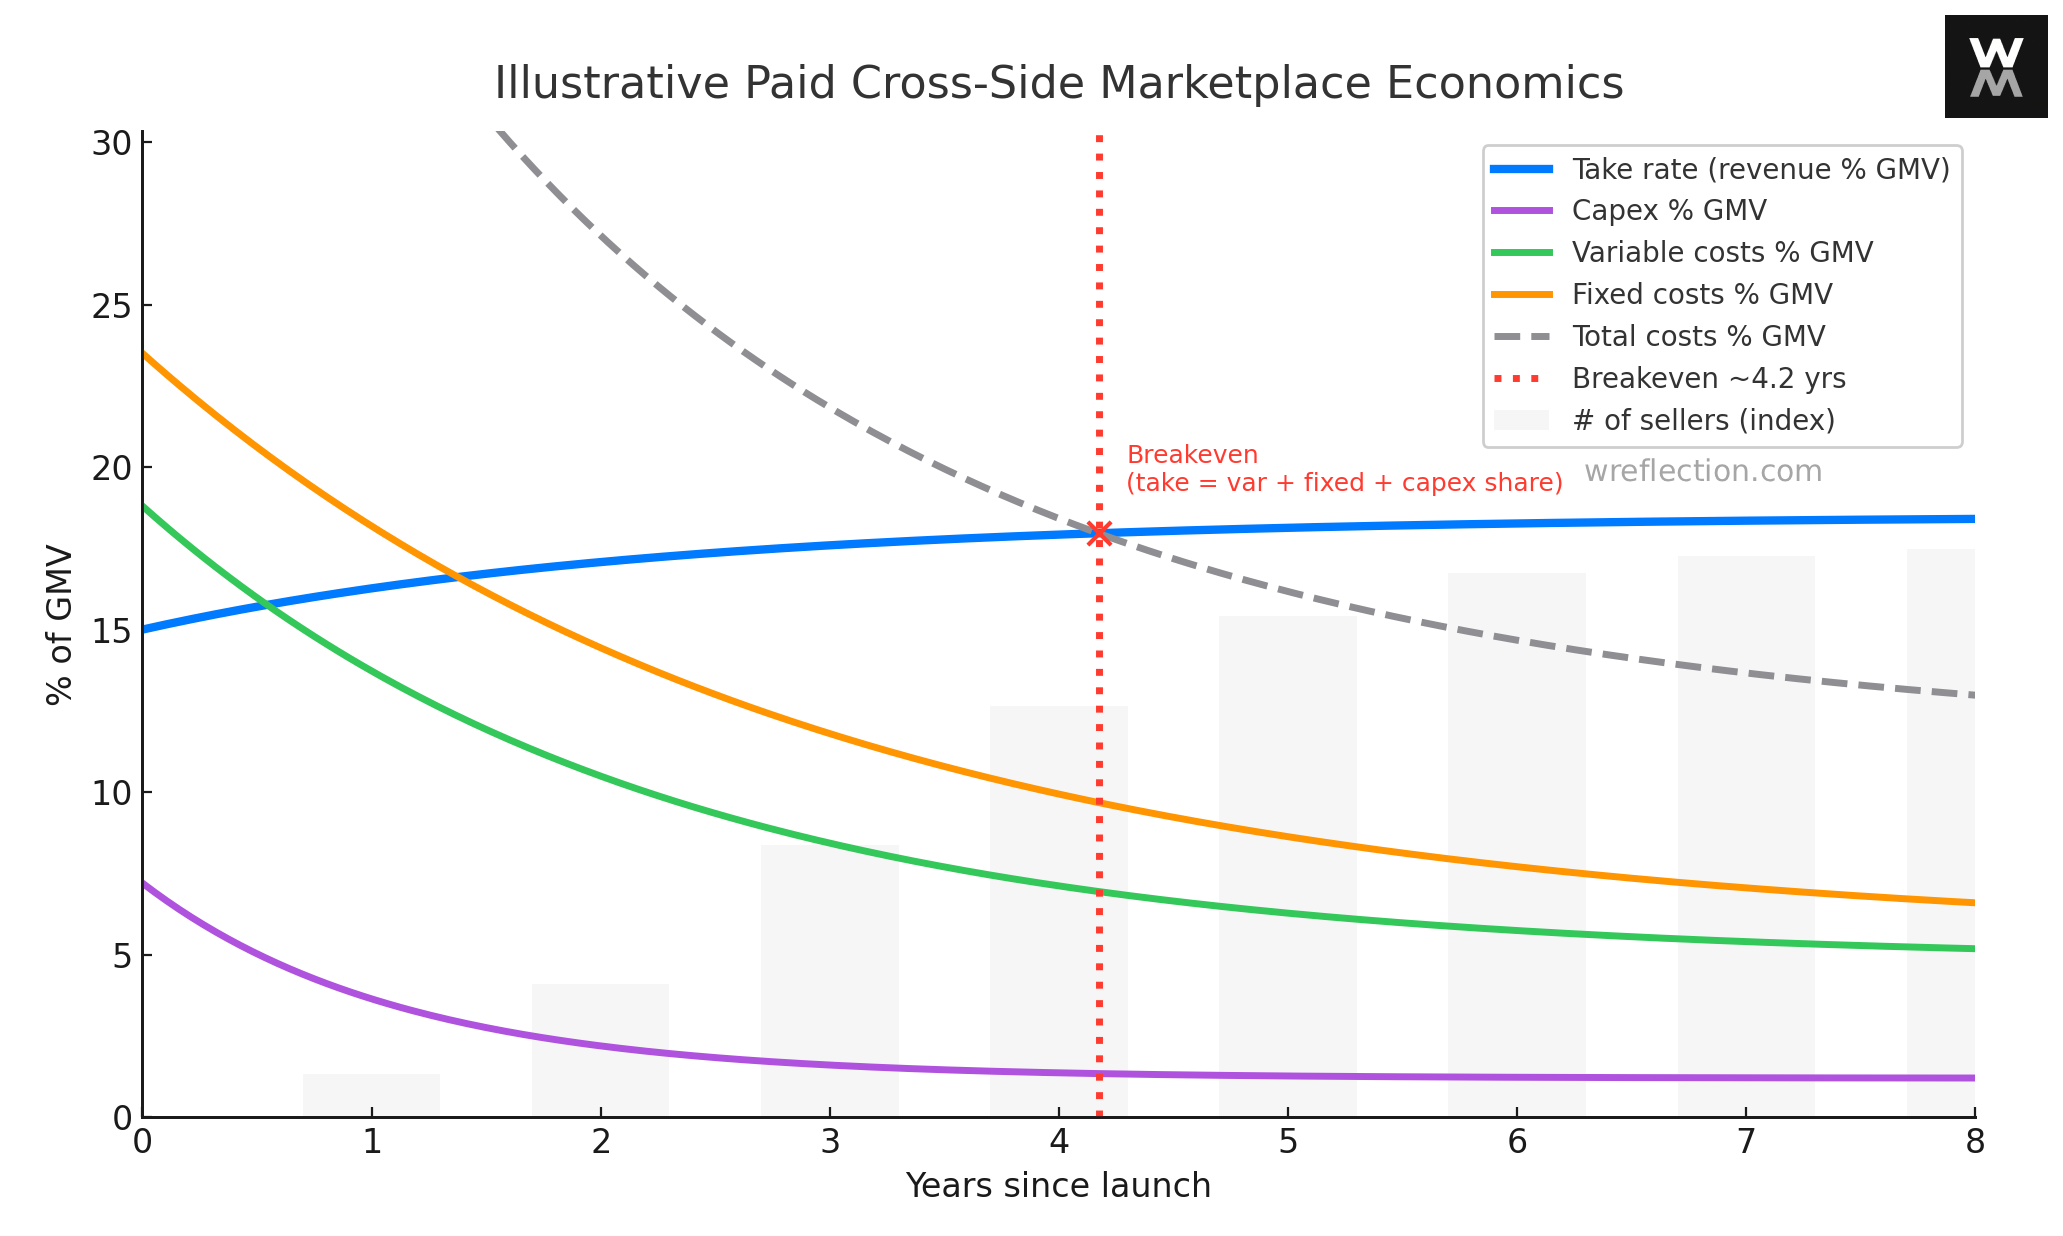
In my view, a balanced paid cross-side platform pricing strategy recognizes four factors - the platform’s position on the pricing-power spectrum above, the underlying cost structure, end-customer price elasticity, and access to patient long-term investors.
In the early stages, a platform may choose their take rate based on access to such long-term investment capital. Those with access to capital can charge a take rate low enough to subsidize liquidity (attract sellers, and thus customers), and those without may charge high enough to account for capital expenses, and fixed and variable costs as a percentage of Gross Merchandise Value (GMV). This ensures sufficient cash flow to keep the business viable.
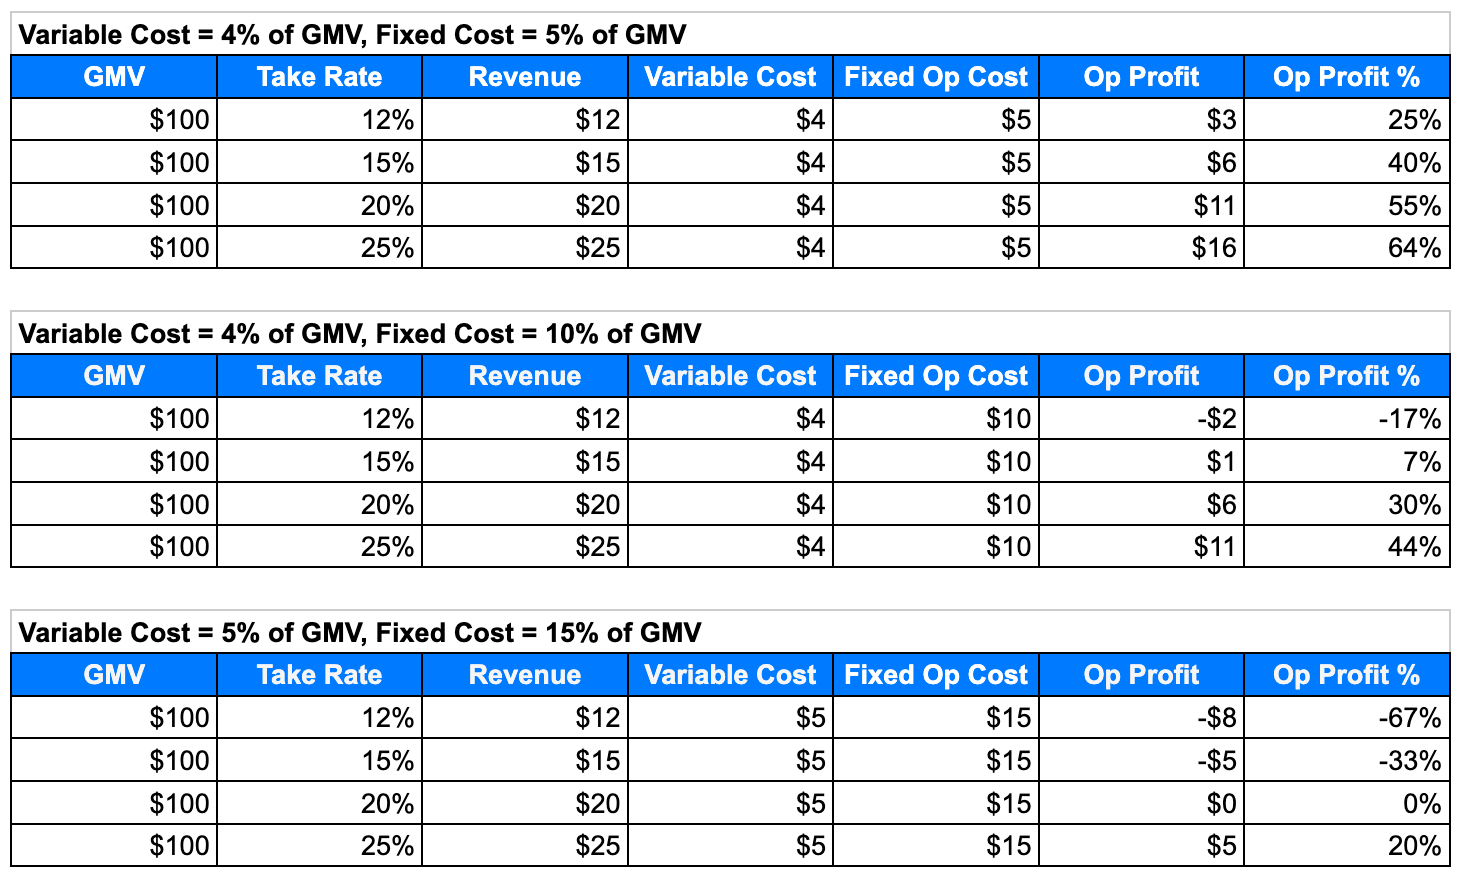
Eventually, as upfront investments are depreciated and fixed costs are spread over more customers and orders, these expenses fall as a share of GMV. At this point, with improved unit economics and a captive base, platforms in winner-takes-most markets might be tempted to raise the take rate to increase profitability. But I think they should resist this temptation and instead pursue the opposite strategy. One that sets the take rate just a touch above variable costs and fixed costs. Such a low but sustainable take rate attracts sellers and is prohibitively hard for new entrants to match/undercut. Importantly, it keeps prices low for end-customers. Sellers typically pass through fee increases to customers as higher prices, which, if the product is price elastic, suppresses transaction volume. If the profit loss from reduced sales exceeds the profit gain from the higher take rate, the rate increase destroys enterprise value.
Complementary Services, Concentration, and Contribution
Beyond the base take rate, platforms can raise their effective take rates by offering value-added services such as payments processing, quality control, insurance, and advertising. These services let suppliers who want more distribution or trust signals pay extra while keeping base prices accessible for others. Consider Amazon’s advertising business, which generated $56B in 2024. Amazon Marketplace’s base take rate sits at around 15-20%, but suppliers who pay for prominent search placement raise Amazon’s effective take rate to an estimated 40-50% if you include advertising and other value added services.
Tanay Jaipuria, a tech investor, explores a few more factors that influence take rates, two of which I find particularly compelling:
Supplier (and buyer) concentration. Fragmented suppliers have little bargaining power and accept higher take rates; concentrated suppliers can negotiate lower rates or threaten to withhold supply. The same logic applies to buyer concentration, though most consumer marketplaces naturally have fragmented buyers.
The best example to highlight this is by digging into Expedia, which sells both flights and hotels. On the flight side, there are typically only ~4 airlines that matter for a given geography, so the supply is very concentrated. Meanwhile, on the hotel side, the supply is much more fragmented. While they don’t breakdown the take rate by segment, most estimates suggest that on the hotel side, their take rate is in the 15-20% range, while on the airlines side it is in the 3-5% range. The concentration is a key driver in this. Think about if Expedia didn’t have United when you performed a search. If you wanted the best price, you could search on Expedia, and then separately search on United before making your purchase.
Incremental sales justify higher take rates. Platforms that generate sales that suppliers wouldn’t have captured on their own can charge more for that incremental value. And the more a platform contributes to a transaction, the higher the take rate it can justify.
One way to see this is to consider the difference between Shopify and Amazon. Shopify provides merchants the tools to set up a store and process transactions but isn’t necessarily bringing them sales and traffic. Meanwhile, Amazon has aggregated 100s of millions of buyers, and sellers lose the ability to reach them on a given search (and potentially make an incremental sale) if they aren’t on Amazon’s third-party marketplace. Shopify’s effective take rate is ~3% while Amazon’s is 10-15% depending on the category of product.
In fact, some marketplaces go as far as charging different take rates on transactions depending on their level of contribution to driving the transaction. Take Udemy’s pricing structure, which highlights the importance of distribution:
If the course is sold through the instructor’s link → instructor keeps 97%
If the course is sold organically on Udemy → instructor keeps 50%
If the course is sold through Udemy’s partners’ → instructor keeps 25%
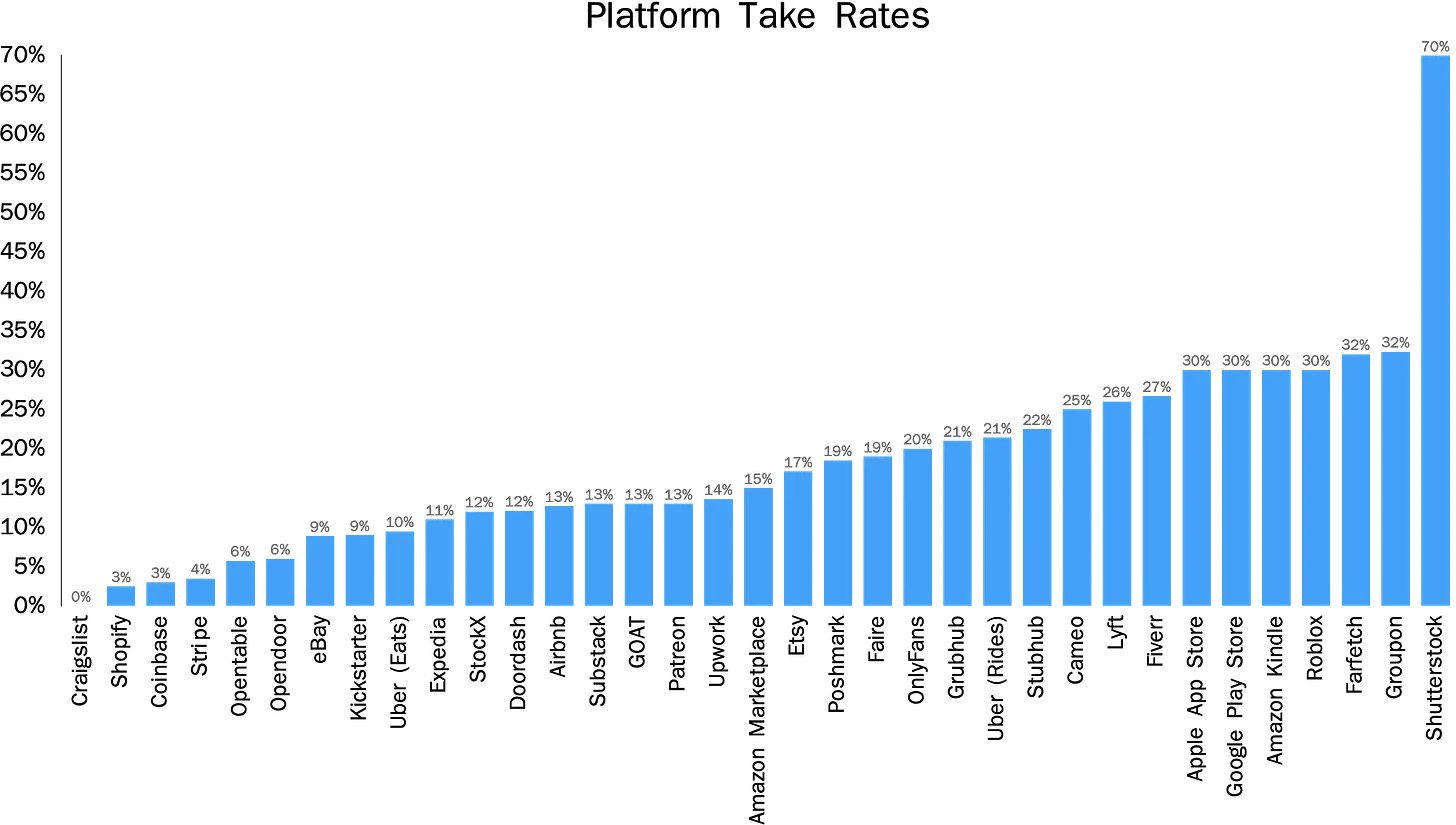
The chart above raises an obvious question, what’s going on with Shutterstock?
Unlike most marketplaces that recognize only their take rate as revenue, Shutterstock reports the full customer payment because it controls the transaction before transferring content. So, per its 2024 financial statements, GMV was approximately reported revenue of $935M. Sales & Marketing (S&M) was $223M (24% of GMV). What this means is that just to cover S&M, Shutterstock needs 24 percentage points of their take rate. Add in other operating costs and their operating profit margin sits at just 7%. In comparison, Airbnb generated $81.8B in GMV, $11.1B in revenue, and only spends $2.1B (2.5% of GMV) in S&M for an operating profit of $2.5B, or 22.5%. I think, unlike Airbnb with its direct traffic and brand strength, Shutterstock competes in fiercely competitive paid search markets for search terms such as “stock photo for”.
This discussion raises a related question about YouTube. How does the platform sustain a 45% take rate? Alphabet/Google does not break out YouTube’s financials separately (technically compliant with legal requirements but debatable given YouTube’s scale and distinct creator business model6). This means we do not know their true cost structure. Assuming YouTube operates more like Airbnb with its 2.6% S&M spend rather than Shutterstock with its 24% paid search dependency, the take rate likely sits well above the optimal rate.
The answer, in my opinion, is Game theory dynamics.
Potential competitors must calculate whether triggering a price war justifies the investment. In YouTube’s case, if a new video platform (say Netflix) launched by offering better rates for creators, YouTube would immediately match it. At equal rates, creators would not move to the new platform since they have already uploaded their entire video portfolios, and built reputations on YouTube. The new entrant would have invested time and capital building the platform for minimal market share gain. From a potential entrant’s perspective, this market is not worth entering. The result is monopolistic/oligopolistic behavior where incumbents can charge above-equilibrium rates7.
The game theory deterrent breaks when competitors exploit technological shifts (AI-generated videos), or pursue different models (shorter video formats such as TikTok). More likely, regulators will need to step in when they see platforms earning outsized profits. Even then, meaningful competition takes years to materialize. New entrants must raise capital, build platform technology, recruit sellers, acquire customers, and critically, help sellers build the reputation and reviews that make them credible. For platforms with geographic constraints such as Uber or Airbnb, competitors must light up city by city, or region by region.
In summary, four forces determine take rates in practice. Platform type (including complementary services, concentration, and contribution) define pricing power, cost structure and supplier margins set the minimum viable take rate, end-customer price elasticity determines how take rate changes affect transaction volume and total profit, and game theory and regulatory action governs how long take rates above equilibrium last. Pricing just a bit above variables costs + fixed costs buffer is the sweet spot where the platform balances seller acquisition, low prices for end-consumers, and long-term defensibility.
If you enjoyed this post, please consider liking the post on Twitter/X or LinkedIn, or sharing it with someone who might also find it interesting.
In traditional tech-speak, platforms are those where other software developers can build applications and software on top of the platform application/software. I take a broader view of platforms, one that includes marketplaces for sellers and buyers to connect, or advertisers and customers to interact. And so I use the terms platform and marketplace interchangeably despite the actual difference.
This is an updated version of an essay I first published on my now defunct blog in 2017. While the classification has limitations, I still find it useful when evaluating platform pricing power.
I define “Take Rate Elasticity” as the sensitivity of seller participation to changes in a platform’s take rate or commission, with pass-through to end prices; it parallels price elasticity of supply and price elasticity of demand but applies to platform fees rather than to product price, and to seller participation rather than product demand or supply. In other words, the percentage change in seller participation (and eventually GMV) for a 1% percent change in the platform’s take rate.
I use variable costs to mean all costs that vary with each transaction. These include performance marketing that scales with sales (search ads tied to conversions, affiliate commissions, sales incentives), even though GAAP classifies these in Sales & Marketing rather than Cost of Revenue. When analyzing platform unit economics from financial statements, you cannot rely solely on the Cost of Revenue line. Shutterstock’s financials illustrate this distinction.
Alphabet began disclosing YouTube advertising revenue separately starting in 2020 (it was $36.1B in 2024 of Google’s total $348B) but does not report YouTube as a standalone operating segment with total revenue (estimates suggest north of $54B in 2024) that includes subscription revenue, separate costs, and profitability. FASB’s ASC 280 requires separate segment reporting when revenue, profit/loss, or assets exceed 10% of consolidated totals. YouTube clearly exceeds the revenue threshold and its creator revenue sharing model operates fundamentally differently from Search or Maps, making a strong case for separate segment treatment.
This dynamic does not hold in most traditional businesses because matching prices leads to market share splitting rather than complete incumbent retention. For example, when an incumbent retailer matches a new entrant’s prices, customers simply split between both stores based on convenience and preference. The game theory deterrent only works in businesses with network effects (platforms), high switching costs (telecom), contractual lock-in (medical equipment, enterprise software), or prohibitive infrastructure requirements (airlines, semiconductors).
Good read. Do you think that hardware is the only factor that helps big platforms differentiate such that they can charge higher take rates?